We've cracked the
YouTube algorithm, so
you don't have to.
After 10,000+ hours dissecting what makes channels blow up, we built Trustscore — the only tool that analyzes 30+ real YouTube API metrics to show you exactly what's stopping your videos from going viral.
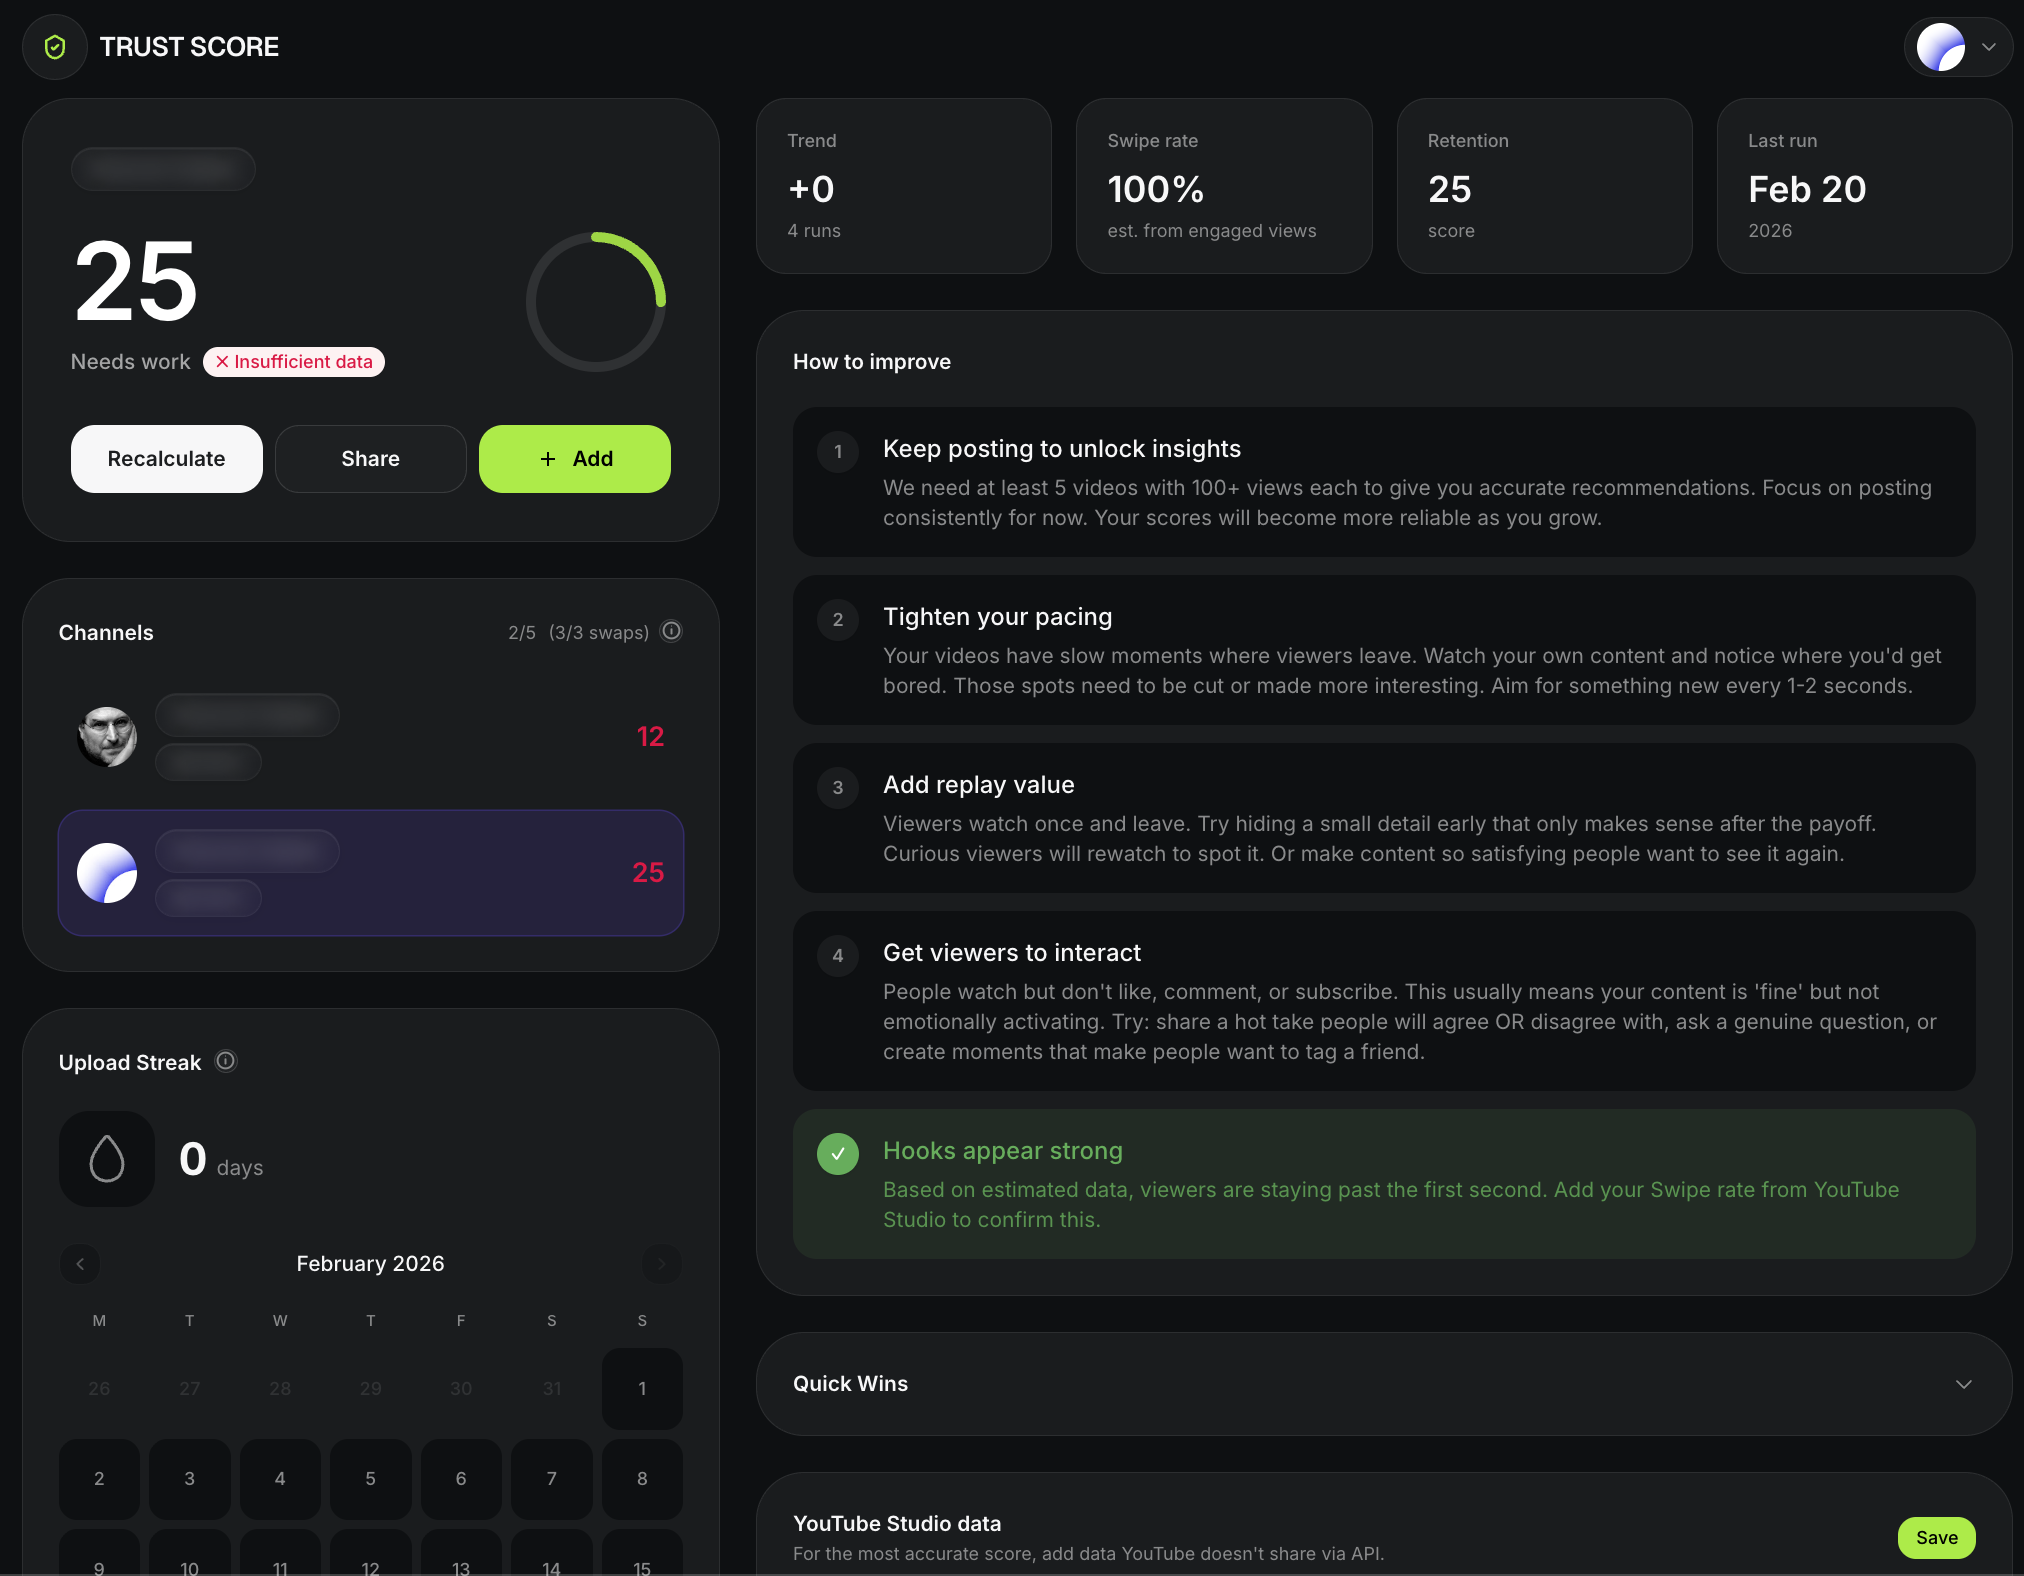
Channel Trustscore
Room for Growth
Example Trustscore for a channel with 45K subscribers. Your score is calculated from your channel's real data via the YouTube API.
30+
Metrics analyzed
60s
Time to results
100%
Real YouTube data
5 min
To first improvement
YouTube trust score checker
Check your YouTube channel trust score with real channel data
YouTube does not publish one official public trust score. Satura Trustscore is a channel health checker that turns the signals creators already have in YouTube Studio into one practical score, then shows which retention, engagement, CTR, consistency, and authority metrics need attention first.
Trustscore explained for YouTube creators
Trustscore is Satura's product name for a YouTube channel health score. Creators search for it as Trustscore, TrustScore, YouTube TrustScore, and YouTube trust score checker. The goal is the same: turn retention, CTR, engagement, upload consistency, and authority signals into one prioritized view of what to fix next.
Connect your channel
Use the YouTube OAuth flow so Trustscore can read your channel analytics securely. No screenshots, spreadsheets, or scraped estimates.
Scan 30+ trust signals
Trustscore checks retention, swipe behavior, CTR, engagement quality, upload consistency, content velocity, and channel authority from real YouTube data.
Prioritize the fixes
Instead of a vague grade, you get the specific weak signals to fix first so you can improve the metrics that affect recommendation confidence.
YouTube trust score ranges
What is a good YouTube Trustscore?
A good YouTube Trustscore is usually 75 or higher. Scores from 50 to 74 mean the channel has mixed signals, while scores below 50 point to weak recommendation readiness. The exact fix depends on which category is weakest: retention, CTR, engagement, consistency, velocity, or authority.
How to check trust score of a YouTube channel
- 1Connect the YouTube channel through OAuth so the checker can read real channel analytics.
- 2Review the overall 0-100 Trustscore and the five category scores.
- 3Start with the weakest category rather than changing every part of the channel at once.
- 4Improve the exact signal named in the action plan, such as CTR, first-second retention, share rate, or upload gaps.
- 5Run the YouTube trust score checker again after 1-2 weeks or after the next batch of uploads.
How to increase YouTube trust score
Increase your YouTube Trustscore by fixing the signals YouTube can measure.
A higher Trustscore does not come from one trick. It comes from improving the measurable signals YouTube uses to decide whether a channel is reliable enough to keep recommending: retention, CTR, engagement quality, upload consistency, content velocity, and channel authority.
Fix the early-viewer signals
Start with swipe rate, first-second retention, average view duration, and CTR. These decide whether YouTube keeps testing a video after the first audience sample.
Prove the channel is consistent
Clean channel setup, predictable uploads, clear niche positioning, and viewer-safe packaging make the channel easier for YouTube to classify and recommend.
Improve one weak category at a time
Use Trustscore to separate retention, engagement, upload behavior, authority, and velocity problems so you are not changing thumbnails when the real issue is watch time.
Connect your channel
Paste your YouTube channel URL or handle
The metrics that actually matter
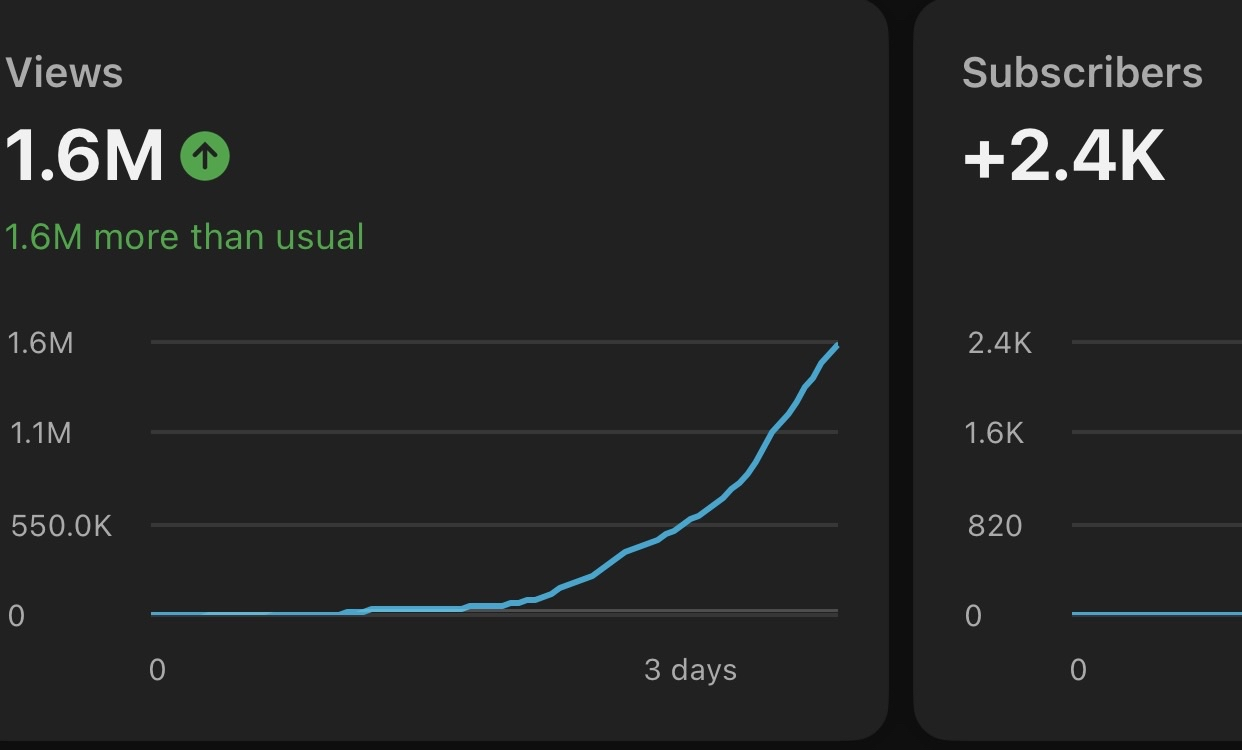
YouTube's recommendation engine doesn't care about your subscriber count. It cares about signals that predict whether a viewer will enjoy your content. Here are the key metrics Trustscore analyzes — and why each one directly affects your reach.
Swipe Ratio
72%The percentage of viewers who watch past the first second of your video. YouTube's algorithm treats the first second as a gate — if most viewers swipe away, the algorithm stops showing your video to new audiences. A swipe ratio above 70% tells YouTube your hooks are working. Below 60%, and your content is essentially invisible in recommendations.
Share Rate
0.12%How often viewers share your content with others. Sharing is the single strongest engagement signal YouTube tracks. When someone shares a video, it's a direct endorsement — and the algorithm weights it more heavily than likes, comments, or even watch time. Most channels hover around 0.05–0.15%. Getting above 0.2% consistently is where viral potential begins.
Upload Consistency
4/6Your posting frequency measured against your own historical baseline. YouTube rewards channels that publish predictably — the algorithm builds a model of when your audience expects content. Gaps in your schedule reset that model and hurt your algorithmic momentum. Trustscore measures not just how often you post, but how consistently you maintain your rhythm.
Average View Duration
3:42How long viewers actually watch before leaving. This is YouTube's primary quality signal. The algorithm compares your average view duration against videos of similar length — so a 4-minute average on a 10-minute video is a strong signal, while 4 minutes on a 30-minute video tells the algorithm most viewers aren't engaged enough to finish.
Click-Through Rate
6.8%The percentage of people who see your thumbnail and title and actually click. YouTube shows your content as impressions first — your CTR determines whether those impressions convert to views. The algorithm uses CTR as a real-time feedback loop: high CTR means more impressions, low CTR means your content gets suppressed in favor of higher-performing videos.
Session Time Impact
+14sWhether your videos keep people on YouTube or cause them to leave the platform. This is one of the most underrated metrics. YouTube wants to maximize total session time, so it rewards channels whose videos lead to more watching. If viewers leave YouTube after your video, the algorithm quietly deprioritizes your content. Trustscore measures your session time contribution directly.
From confusion to clarity in 60 seconds
Trustscore doesn't just measure your channel — it tells you exactly what to do next, in order of impact.
Diagnose what's actually wrong
Most creators guess why their videos don't perform. Trustscore removes the guesswork by analyzing the exact metrics YouTube's algorithm uses to make recommendation decisions. You'll see precisely which signals are dragging your score down — whether it's your first-second retention, share rate, upload gaps, or something you never thought to check.
Get a prioritized action plan
Knowing your problems isn't enough. Trustscore ranks your issues by impact, so you fix the things that will move the needle most first. Each recommendation comes in plain English with specific, actionable steps — not vague advice like "make better thumbnails." We tell you exactly what to change and why it matters algorithmically.
Track progress over time
Run Trustscore again after making changes and see your score move. Track each individual metric over weeks and months to understand what's working. Small improvements compound — a 5-point increase in your Trustscore can meaningfully change how often YouTube recommends your content to new viewers.
30+ signals across five categories
Every metric is pulled directly from the YouTube API based on your channel's real data. Nothing estimated, nothing scraped.
Audience Retention
How well your content holds attention from first second to last
Engagement Quality
The signals YouTube values most when deciding to recommend content
Upload Behavior
Your posting patterns and how they affect algorithmic momentum
Channel Authority
Long-term trust signals that compound over time
Content Velocity
How fast your content picks up momentum after publishing
Small score changes,
big view differences
YouTube's algorithm operates on thresholds. A video doesn't need to be perfect — it needs to cross key thresholds in the metrics that matter. Trustscore identifies exactly which thresholds you're falling short of and what it takes to cross them.
Creators who follow Trustscore's prioritized recommendations typically see measurable view increases within 2–4 weeks. Not because of luck — because they stopped guessing and started fixing the actual signals the algorithm uses.
- Every recommendation explains the algorithmic reason behind it
- Fixes are ordered by expected impact on your Trustscore
- Track which changes moved the needle and which didn't
- Re-scan weekly to measure your progress over time
- Benchmarked against channels in your niche and size range
47
Before
68
After 4 weeks
+340% average view increase
Trustscore vs. guessing
Most creators rely on intuition or surface-level analytics. Trustscore gives you algorithmic-level insight.
Built for creators who want to grow
Whether you're just starting or already have an audience, Trustscore adapts its recommendations to your channel's specific situation.
New channels
Find out which fundamentals to nail before you burn through your early momentum.
Plateaued creators
Identify the specific metrics holding you at your current level and break through.
Consistent uploaders
Optimize what's already working. Small tweaks to strong channels yield big results.
Multi-format creators
Understand how Shorts, long-form, and Lives each contribute to your overall score.
YouTube doesn't recommend channels.
It recommends trust.
YouTube's recommendation system doesn't think in terms of "good channels" or "bad channels." It thinks in terms of prediction confidence. Every time it considers showing your video to a viewer, it asks one question: how confident am I that this person will enjoy this?
That confidence comes from signals — your historical retention data, engagement rates, how quickly viewers respond to your content, how often it gets shared, whether it contributes to longer YouTube sessions. These signals compound into what we call your channel's "trust" with the algorithm.
When trust is high, YouTube takes bigger bets on your content — showing it to more people, in more surfaces, more quickly after upload. When trust is low, your content gets tested with smaller audiences and needs to over-perform just to get basic distribution.
Trustscore makes this invisible system visible. It quantifies your channel's algorithmic trust into a single number, breaks it down by category, and shows you exactly where to improve. The creators who understand this system grow. The ones who don't keep guessing.
High trust (75+)
Algorithm actively promotes your content
Medium trust (50–74)
Content gets tested but not pushed
Low trust (below 50)
Limited distribution, small test audiences
Your entire channel health,
one dashboard
Trustscore connects directly to your YouTube account via OAuth and pulls your real analytics data. In under 60 seconds, you get a complete breakdown of your channel's algorithmic health — no manual data entry, no CSV uploads, no guesswork.
- Overall Trustscore with category breakdowns
- Individual metric scores with explanations
- Prioritized recommendation list
- Historical tracking to measure improvement
- Benchmark comparisons with similar channels
Frequently asked questions
More tools for creators
Trustscore tells you what to fix. The rest of Satura helps you fix it — from subtitles and clipping to AI-powered editing.
Quick Subtitles
Add viral-style captions to any video in one click.
AutoClip
Turn long videos into viral short-form clips automatically.
AI Voiceovers
Generate natural-sounding voiceovers in 30+ voices.
AI Image Generator
Create thumbnails and visuals from text prompts.
Background Remover
Remove backgrounds from images and videos instantly.
AI Video Generator
Turn scripts into fully rendered video clips.
Stop guessing. Start growing.
Connect your YouTube channel and get your Trustscore in under 60 seconds. Free to start, no credit card required.
Get Your Free Trustscore