What is the quick answer?
Explore what a video analytics platform is and how it turns data into views. Our guide covers key metrics, use cases, and choosing the right tools for growth.
Key takeaways
- That Feeling When Your Views Flatline
- The dashboard usually stops too early
- Why this category keeps growing
- What Is a Video Analytics Platform Really
- How the machine actually “watches” video
- Why dashboards confuse so many creators
Overview
You publish a video you thought would hit. The idea felt strong. The edit was clean. The thumbnail looked solid. Then the numbers crawl in and nothing moves.
So you refresh. You tweak the title. You blame the algorithm for a while. Then you start wondering if the problem is the video, the packaging, the niche, the audience, or just bad luck.
That loop burns creators out fast because the dashboard usually tells you what happened, not why it happened. Low views. Weak retention. Mediocre click-through. Nice. But what are you supposed to fix next?
That's where a Video Analytics Platform starts earning its keep. Not as some enterprise toy for security teams. As a practical creator tool that helps solo operators and small teams make better calls. Faster intros. Sharper hooks. Smarter clip selection. Better publishing decisions. Less guessing.
That Feeling When Your Views Flatline
You know the pattern. A creator spends hours scripting, recording, editing, captioning, exporting, uploading, and writing a description. Then the video lands with a shrug.
The worst part isn't the low view count. It's the fog. You can't tell whether viewers hated the opening, got confused halfway through, clicked because of the thumbnail but bounced because the promise was off, or never got served the video enough to matter. If you've ever stared at your analytics thinking, “Something's wrong, but I can't prove what,” you're not alone. That spiral is exactly why posts like what is wrong with my stats resonate with creators.
The dashboard usually stops too early
Most native platform analytics are fine for basic reporting. They tell you the outcome. They rarely behave like a proper diagnostic tool.
A real Video Analytics Platform acts more like a flight recorder for your content. It helps you trace the chain of events. Where people dropped. Which segment held attention. What kind of content format consistently loses viewers. Which videos create curiosity and which ones create instant exits.
Practical rule: If your analytics only report results after a flop, you're still guessing.
Why this category keeps growing
This isn't a niche corner of creator tech anymore. The global video analytics market reached USD 12.71 billion in 2024 and is projected to surge to USD 37.84 billion by 2030, expanding at a strong CAGR of 19.5%. This growth is fueled by AI-driven tools that provide real-time, actionable insights, according to Grand View Research's video analytics market analysis.
That matters because better tooling changes how creators work. You stop asking, “Why didn't this video work?” in a vague, emotional way. You start asking better questions.
Those are creative questions, not spreadsheet questions. And that's the point. Analytics become useful the moment they help you make editorial decisions instead of just stare at postmortems.
- Was the opening too slow
- Did the payoff arrive too late
- Did the audience expect one thing and get another
- Did a specific segment kill momentum
- Did the content hold attention but fail to trigger action
What Is a Video Analytics Platform Really
Strip away the jargon and a Video Analytics Platform is three things at once.
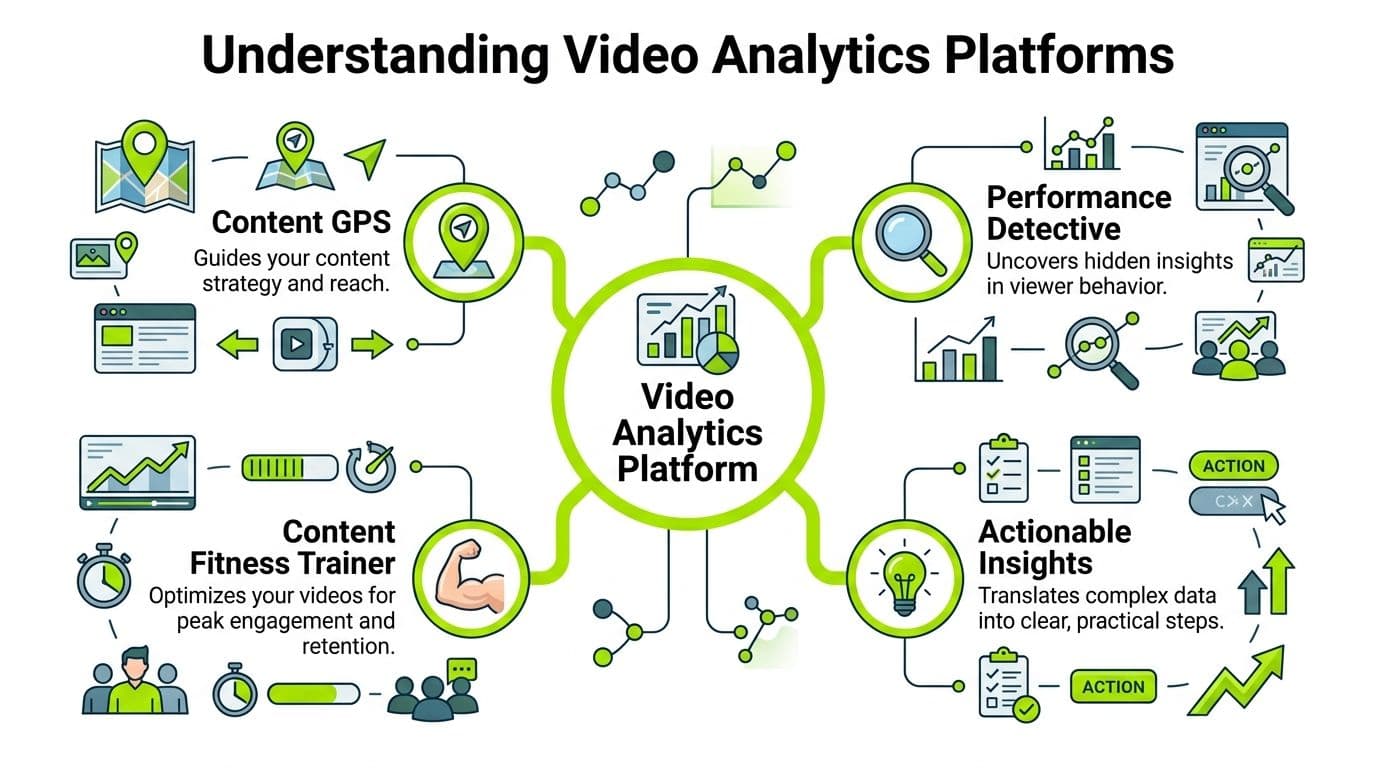
It's your content GPS. It shows where viewers go off course. It's your performance detective. It spots patterns you'd miss by eyeballing a dashboard. It's your content trainer. It pushes you toward tighter structure, stronger pacing, and better packaging.
How the machine actually “watches” video
At a technical level, a platform doesn't watch video the way a person does. It processes it. A video analytics platform uses computer vision to automatically break video into individual frames, identify objects and behaviors, and extract metadata, transforming passive video into proactive, quantifiable intelligence, as described in Wavestore's guide to video analytics platforms.
For creators, the important part is what that means in practice.
A machine can tag what appears on screen, detect scene changes, associate timing with audience response, and connect visual or structural moments with outcomes. Not perfectly. Not magically. But well enough to reveal patterns you can use.
Think of metadata as notes the system writes while your video plays:
- Visual notes like scene changes, movement, or what appears in frame
- Behavior notes tied to audience response around key moments
- Timing notes that show where a hook lands, where a story slows down, and where attention leaks
Why dashboards confuse so many creators
The average creator doesn't need more charts. They need clearer interpretation.
That's why simple scoring systems catch on. If you've looked into tools that summarize channel health, you've probably seen the appeal of a plain-language score instead of twenty disconnected graphs. A useful example is a YouTube Trust Score explainer, because it shows why creators keep asking for analytics that diagnose instead of just display.
Here's the trade-off I see constantly:
| Approach | What it gives you | What it misses |
|---|---|---|
| Native dashboard | Basic reporting | Clear next steps |
| Generic analytics suite | More metrics | More confusion |
| Creator-focused analytics | Diagnosis and prioritization | Sometimes less raw granularity |
The best setup depends on your workflow. If you run a media team, deep granularity helps. If you're a solo creator publishing weekly, you need speed. You need a tool that says, “your opening loses people,” not one that hands you six tabs and a headache.
Good analytics don't just measure a video. They shorten the distance between signal and creative action.
The Six Key Metrics That Actually Drive Growth
Most dashboards bury the useful stuff under vanity noise. For creators, six signals do most of the heavy lifting. If these are healthy, content usually has a shot. If they're weak, the rest of the numbers rarely save you.
Near the top of the stack are quality and engagement signals. Successful platforms capture Quality of Experience indicators like playback failures and drop-off points, alongside engagement metrics like total time viewed, to inform strategic adjustments to content and audience engagement, according to Wowza's breakdown of video analytics.
Here's the short visual version first.
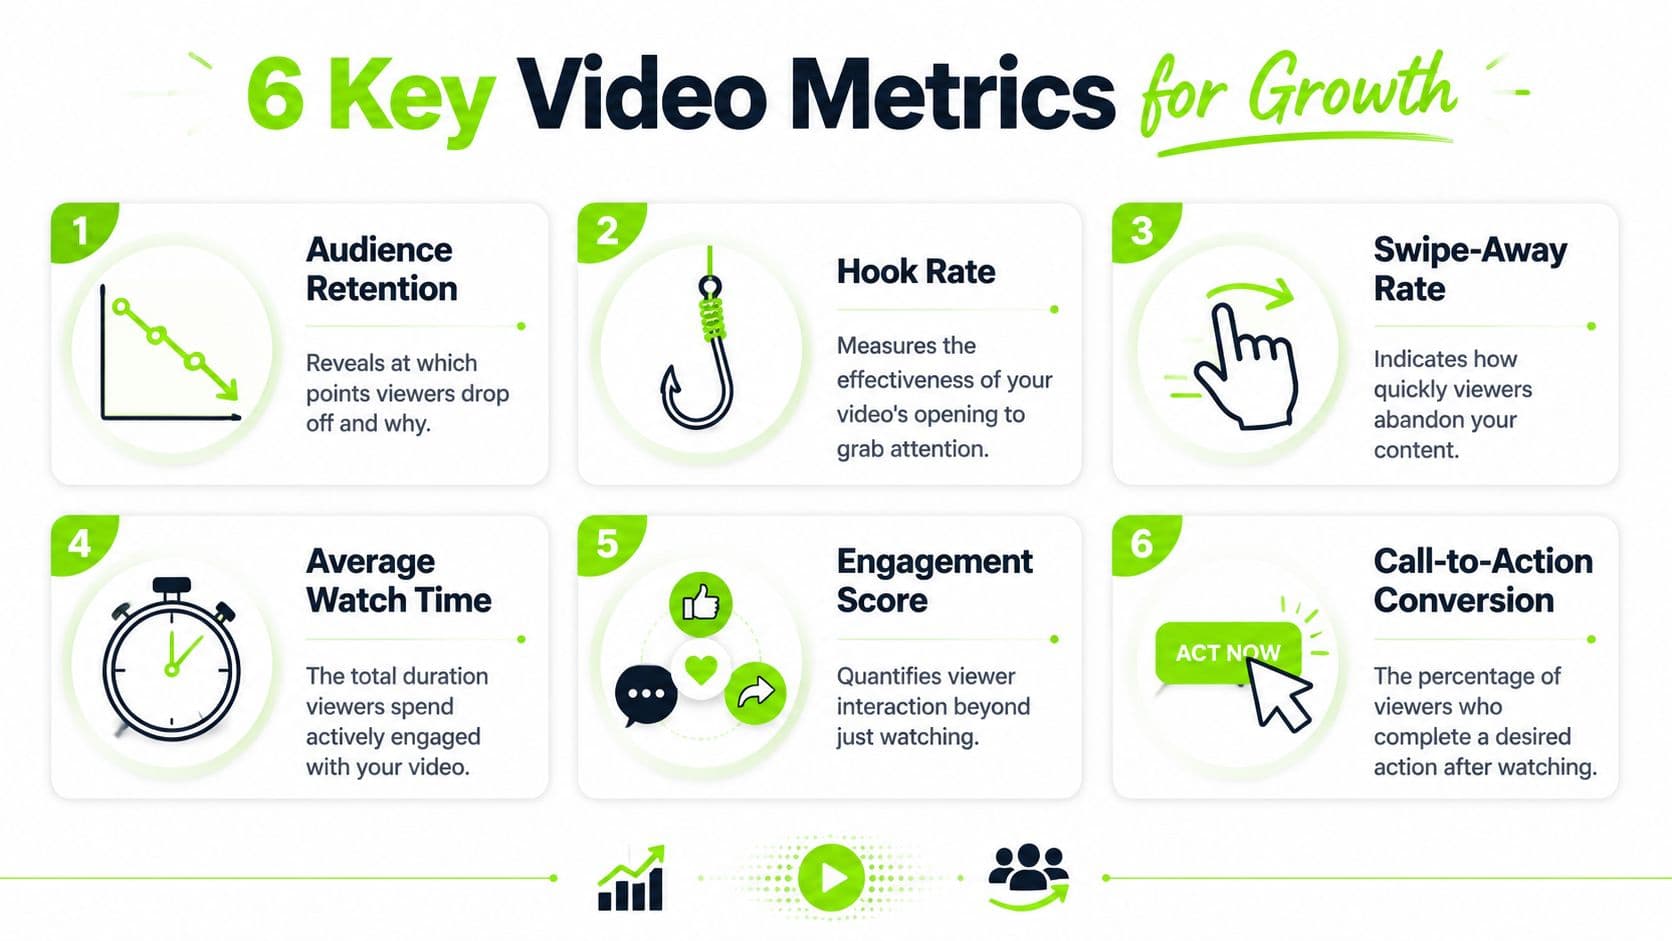
Retention tells you where the video stops earning attention
Your retention graph is not decoration. It's the cleanest record of audience boredom, confusion, satisfaction, and curiosity.
A sharp drop near the start usually means the setup took too long or the title promised something the intro didn't deliver. A mid-video dip often points to repetition, weak pacing, or a tangent that should've been cut. A spike can mean viewers rewatched a useful, funny, or surprising moment.
Hook rate tells you if the opening deserves a chance
Creators love polishing the middle of a video. The audience judges the first seconds.
A weak hook means people never reach the good part. That's why opening lines, first visuals, and immediate tension matter so much. If your short-form videos get brushed away fast, your opener isn't doing its job.
If you're trying to interpret packaging and early response together, a practical benchmark article like what is a good click through rate on YouTube helps frame the question the right way. Clicks and retention have to work together. A flashy thumbnail with a weak opening still fails.
Swipe-away rate reveals instant rejection
Short-form creators ignore this at their own risk.
Swipe-away behavior tells you whether the viewer understood the premise immediately and cared enough to stay. If they leave fast, your visual opening, first sentence, pacing, or framing probably missed. That doesn't always mean the topic is bad. Often it means the first few seconds buried the strongest angle.
Here's a useful pattern:
A good reference point for creators working in long-form audio and video is this guide on how to grow your YouTube podcast. Podcast creators often have solid substance but lose viewers early because they open too slow.
A quick demo can help anchor the difference between numbers and diagnosis.
- High swipe-away with a decent idea means the hook is weak.
- Low swipe-away but poor retention later means the hook worked, but the structure didn't.
- Strong retention and weak engagement means the video held attention but didn't provoke reaction.
Average watch time shows whether people stay with your pacing
This is the endurance metric. Not just “did they click,” but “did they keep investing time.”
Average watch time helps expose bloated edits. Long pauses. Repeated points. Overbuilt intros. Meandering explanations. If people consistently leave before the value lands, the structure is working against you.
What are the common questions?
What is the short answer for Video Analytics Platform: The Ultimate Creator's Guide?
Explore what a video analytics platform is and how it turns data into views. Our guide covers key metrics, use cases, and choosing the right tools for growth.
What should creators do first?
Metric usefulness: Does it surface retention, hooks, engagement, and audience behavior in a way you can act on?
Who is this guide for?
This guide is for YouTube creators, faceless channel operators, agencies, and teams using AI tools to improve video production and growth.
Action checklist
Apply this to your channel today.
- 1Metric usefulness: Does it surface retention, hooks, engagement, and audience behavior in a way you can act on?
- 2Recommendation quality: Does it diagnose problems, or does it dump graphs in your lap?
- 3Workflow integration: Can it connect cleanly with the channels you already publish on?
- 4Publishing value: Can it help you refine ideas and packaging, not just review results after the fact?
- 5Learning curve: Will you use it every week, or avoid it because it feels like homework?