YouTube retention analysis tool.
Fix drop-offs before you upload.
Virality Lab reviews hook strength, pacing, retention-curve risk, and viewer drop-off moments before you publish. Get timecoded fixes for the exact seconds that are likely to kill watch time.
Retention diagnostics
Find the retention problems YouTube Analytics shows too late.
YouTube retention analysis tool
Analyze hook strength, pacing, novelty, payoff timing, and viewer drop-off risk before a video goes live.
Video drop-off analysis
Find the exact moments where viewers are likely to leave, then get a timecoded fix for each weak segment.
Retention curve analyzer
Connect YouTube data to compare the predicted retention timeline against your real audience retention curve.
Shorts and long-form retention checker
Use the same review workflow for YouTube Shorts, Reels, tutorials, explainers, podcasts, and long-form videos.
Audience retention
What is YouTube audience retention?
YouTube audience retention shows how much of a video viewers keep watching at each moment. In YouTube Studio, the retention graph highlights intros, top moments, spikes, and dips so creators can see where attention holds, where viewers rewatch, and where they leave or skip ahead.
Virality Lab turns that retention reading into an edit workflow. Before publishing, it predicts hook risk, pacing problems, visual lulls, and likely drop-off points. After publishing, connected YouTube data can help compare those predictions against the real retention curve.
Intro
The opening window shows whether viewers stayed after the first 30 seconds.
Compare the title and thumbnail promise against the first payoff, then cut any slow setup before the value appears.
Top moments
Flat or high-retention sections show where almost no one left while watching.
Move that kind of payoff earlier, repeat the format, or expand the idea into the next video.
Spikes
Spikes usually mean viewers rewatched or shared a specific moment.
Check whether the spike came from strong value or from a confusing section that needed a second watch.
Dips
Dips mark moments where viewers skipped ahead or stopped watching.
Review the exact timestamp for dead air, repeated context, unclear payoff, bad audio, or a visual lull.
Source context: YouTube Help explains key moments for audience retention. For CTR plus retention interpretation, use the YouTube CTR guide.
YouTube Analytics workflow
Use impressions click-through rate and audience retention together.
YouTube Analytics separates reach signals, like impressions and impressions click-through rate, from engagement signals, like watch time, average view duration, and audience retention. CTR diagnoses the package. Audience retention diagnoses the video experience after the click.
Impressions click-through rate
Reach
Did the title and thumbnail earn a click when YouTube showed the video?
If CTR is weak but retention is strong, improve the title, thumbnail, and topic promise before changing the edit.
Audience retention graph
Engagement
Where did viewers keep watching, rewatch, skip ahead, or leave?
Use Virality Lab to inspect the exact timestamp, then cut dead air, move the payoff earlier, or add a visual reset.
Average view duration and watch time
Engagement
How much viewing time did the video actually earn after the click?
Compare watch time against retention dips so the fix targets the moment that lost attention, not just the headline metric.
Source context: YouTube Help documents impressions and impressions click-through rate in YouTube Analytics basics, and explains audience retention separately through key moments for audience retention.
Beyond the transcript
Three AI layers analyze every second
Most tools only read the transcript. Virality Lab sees what the viewer sees: visuals, audio, pacing, and spoken content analyzed together for the first time.
Visual AI Analysis
Watches every frame for scene changes, pacing, on-screen text, facial expressions, and visual monotony. Not just a transcript reader.
Transcript + Audio Intelligence
Maps spoken content for clarity, repetition, dead air, verbal stumbles, and promise-payoff timing across the full video.
Synthetic Audience Panel
AI viewer personas vote on every segment. Predicts where real audiences would click away before a single viewer sees it.
Visual intelligence
AI watches your video
like a viewer would
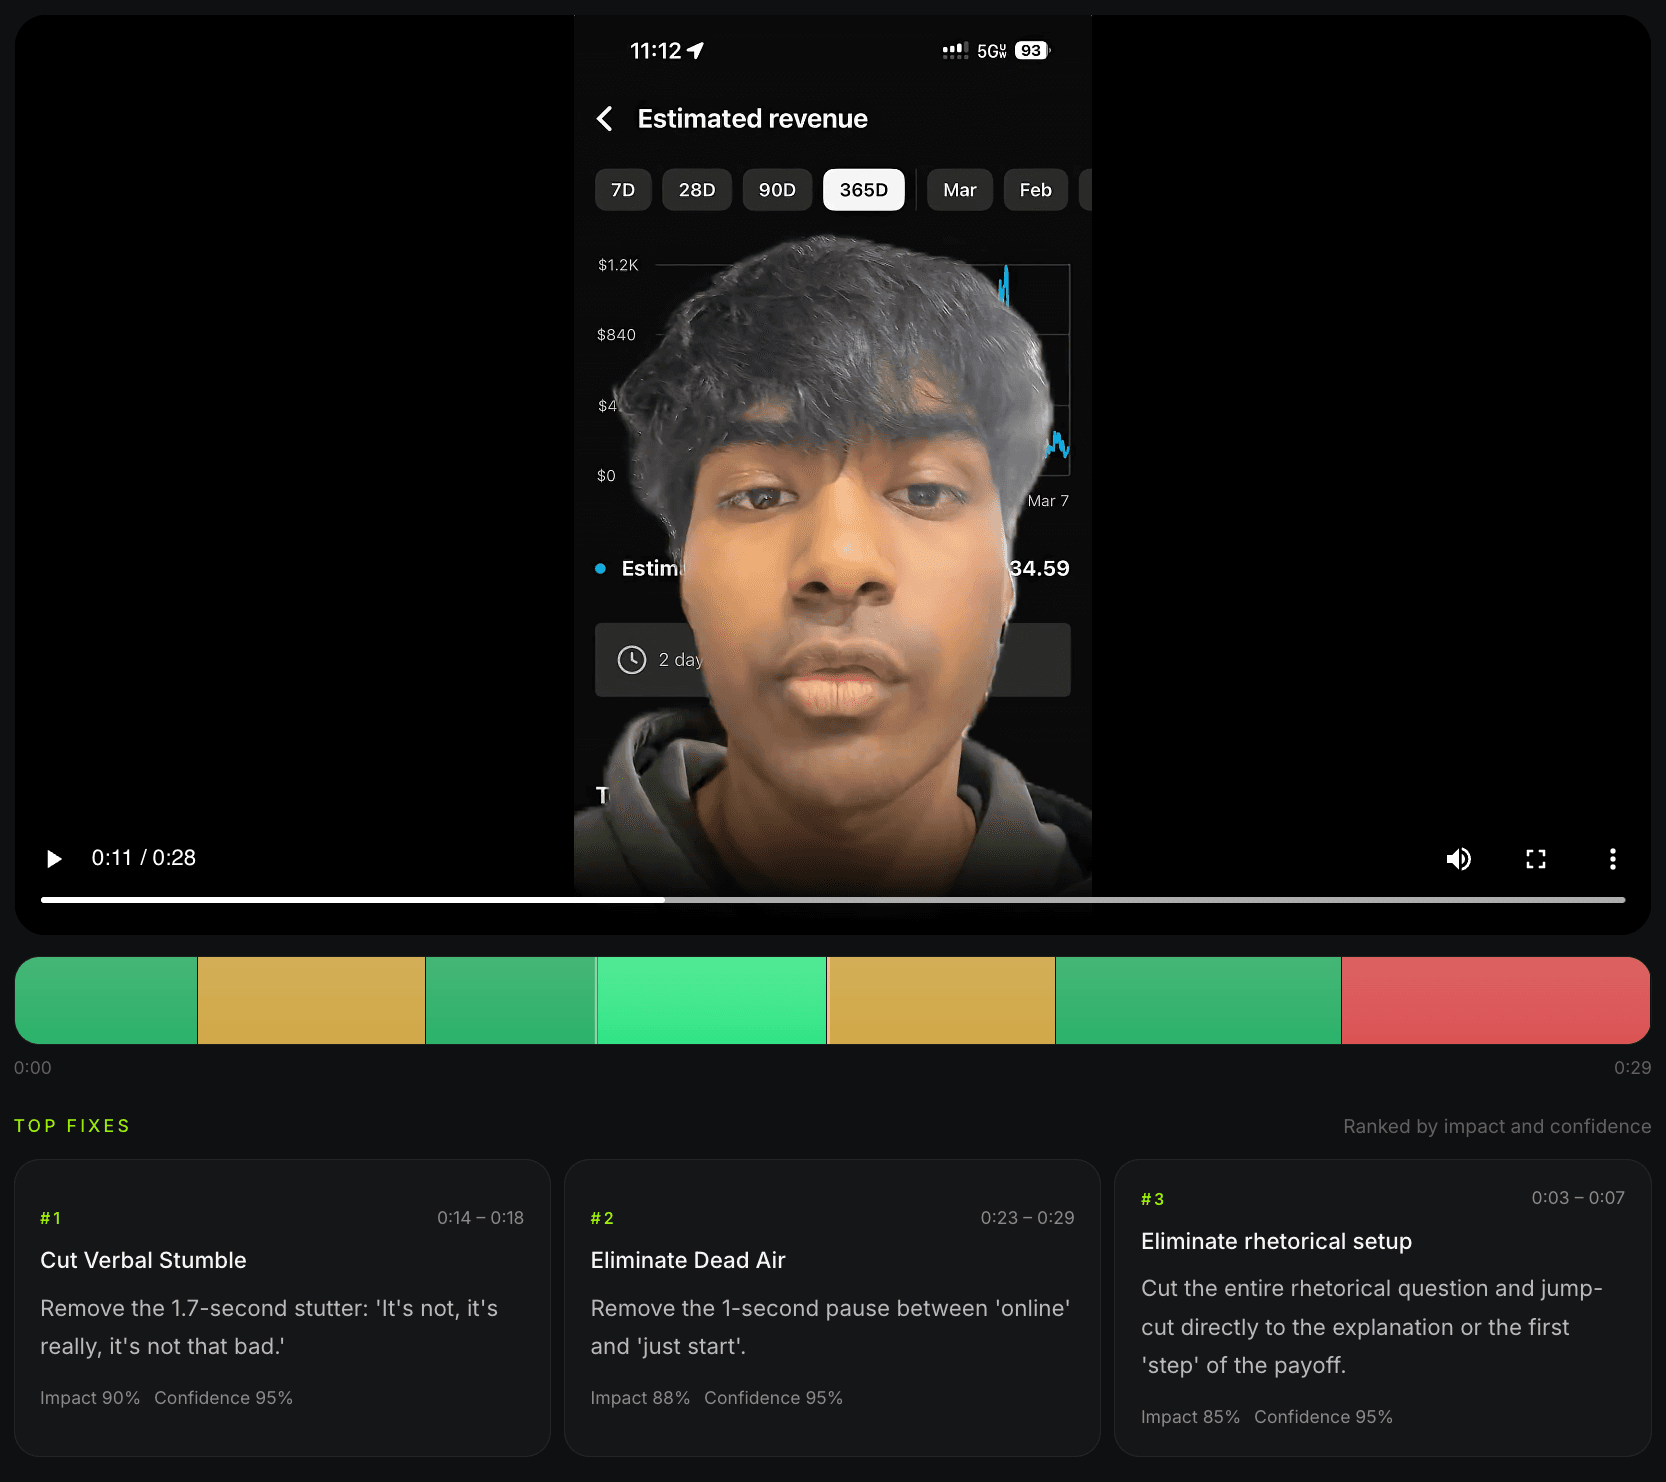
Every segment gets scored across six dimensions. The retention timeline shows exactly where attention holds and where it breaks, color-coded so you can scan the full video in seconds.
- Green zones: holding attention, earning runtime
- Yellow zones: light touch, small edit, big improvement
- Red zones: high drop-off risk with specific fixes
- Real retention curve overlay when connected to YouTube
Six-Dimension Retention Score
Does the first 5 seconds earn the next 30?
Are promises resolved before patience runs out?
How often does the video introduce something new?
Can a first-time viewer follow without rewinding?
Does the emotional register shift or flatline?
How frequently does the visual composition change?
From upload to actionable fixes in minutes
Four steps. No learning curve. Your video goes in, retention intelligence comes out.
Upload or import
Drop a video file, paste a YouTube URL, or select from your connected channel. Works with published and unpublished content.
AI analyzes every moment
Visual models scan each frame. Audio and transcript are mapped for pacing, clarity, and engagement signals. Audience personas predict drop-off points.
Get ranked fixes
Each risk zone gets a specific fix: cut a stumble, tighten dead air, reorder a payoff. Ranked by impact and confidence with exact timecodes.
Edit or brief your editor
Fix the moments directly in Satura's editor, or generate a detailed brief to send to your editor with every fix, timecode, and priority.
Cut Verbal Stumble
Remove the 1.7-second stutter: 'It's not, it's really, it's not that bad.'
Eliminate Dead Air
Remove the 1-second pause between 'online' and 'just start'.
Eliminate rhetorical setup
Cut the entire rhetorical question and jump-cut directly to the explanation.
Fixes that move the needle,
not just noise
Every fix tells you exactly what to change, where it is, and how much it matters. Impact and confidence scores help you prioritize. Edit the three things that will make the biggest difference, not fifty things that won't.
- Ranked by expected impact on retention
- Exact timecodes for every fix
- Specific instructions, not vague suggestions
- One-click editor brief for your team
One click to brief your editor
Don't edit yourself? Generate a complete editor brief with every fix, timecode, priority ranking, and description. Your editor gets exactly what they need to improve retention without back-and-forth or guessing.
#1 [0:14-0:18] Cut verbal stumble. Remove the 1.7s stutter "It's not, it's really, it's not that bad." Impact: 90%
#2 [0:23-0:29] Eliminate dead air. Remove 1s pause between "online" and "just start". Impact: 88%
#3 [0:03-0:07] Cut rhetorical setup. Jump-cut to explanation or first step of the payoff. Impact: 85%
Virality Lab vs. transcript-only tools
Most retention tools can only read words. Virality Lab sees what your viewers see.
Built for creators who care about retention
YouTube creators
Analyze any video before or after publishing. Catch the moments that cost you watch time and fix them before they hurt your performance.
Video editors
Get AI-backed evidence for every cut. Stop guessing which sections to trim and let retention data drive your editing decisions.
Content teams
Generate editor briefs automatically. The creator runs the analysis, the editor gets a detailed fix list with timecodes and priorities.
Data-driven creators
Connect your YouTube channel for real retention curve overlay. Calibrate AI predictions against actual viewer behavior.
Short-form creators
Every second matters in Shorts and Reels. Virality Lab catches the micro-moments like a half-second stumble or a missing hook that tank retention on short content.
Agencies & managers
Standardize retention review across clients. Run any video through the same rigorous analysis and share professional briefs.
Frequently asked questions
More tools for creators
Virality Lab works best alongside Satura's editor, AutoClip, and Trust Score for a complete content optimization pipeline.
AutoClip
Turn long videos into viral short-form clips with AI.
Trust Score
Get your channel's algorithmic health score.
Creative Library
Discover trending videos, outlier content, and niches.
AI Video Editor
Edit videos with AI-assisted speed and control.
Quick Subtitles
Add viral-style captions to any video in one click.
AI Image Generator
Create thumbnails and visuals from text prompts.
Stop losing viewers to fixable moments.
Upload a video. Get every retention risk identified and ranked. Fix the moments that matter most in minutes.
Analyze Your First Video