
What is the quick answer?
What is a good CTR on YouTube, Shorts, and display ads? Learn realistic benchmarks by traffic source, diagnose weak clicks, and fix packaging with Satura AI.
Key takeaways
- Why a Single Good CTR Number Is Misleading
- Realistic CTR Benchmarks by Platform and Traffic Source
- Why CTR Alone Can Be a Trap
- Read the first moments as a promise check
- How to Diagnose Weak CTR Using Analytics
- Separate the source before changing the package
Overview
A good YouTube CTR is typically 4%–6% on average, 7%–8% strong, and 12%+ elite. The answer depends on whether those impressions came from Search, Browse Features, or Suggested Videos, and whether the click leads to strong retention.
That immediately challenges the most popular advice about CTR: there isn't one magic number that tells you whether a video is healthy. A 4% CTR can be perfectly respectable for a broad browse audience and underwhelming for highly targeted search traffic. A higher CTR can also hide a weak opening, a misleading promise, or viewers who click and leave almost immediately.
Creators often treat CTR like a grade. In practice, it's closer to a diagnostic signal. It tells you how effectively your packaging converts an impression into a view, but it doesn't tell you whether the right viewer clicked, stayed, enjoyed the video, or watched something else afterward.
Why a Single Good CTR Number Is Misleading
The question “what is a good CTR” sounds simple because YouTube Studio places one percentage directly in front of you. That number combines impressions from different surfaces, audiences, and viewer intentions. Search viewers actively request an answer, while Home viewers are casually choosing among competing recommendations. Their clicks shouldn't be judged by the same standard.
YouTube's widely cited guidance frames most channel impressions CTR within 2%–10%, and modern creator benchmarks commonly describe 4%–6% as average, 8%–10% as strong, and 12%+ as elite (creator-industry CTR benchmark guidance). Those ranges are useful orientation points, not a universal scoreboard. A search-driven tutorial can outperform a browse-heavy vlog even when both videos belong to the same channel.
Practical rule: Compare a video with its own traffic-source history before comparing it with another creator's headline number.
A 4% result may signal different things depending on where YouTube showed the video. Search viewers usually arrive with a defined need, so the title and thumbnail have a clearer opportunity to match intent. Browse viewers may not have been looking for the topic at all, which makes the thumbnail's visual promise and emotional relevance more important.
The post-click experience changes the interpretation again. A thumbnail can earn attention by creating curiosity, but if the opening doesn't quickly confirm the reason for the click, viewers may leave. That creates a hollow win: the packaging attracts people, yet the video fails to create sustained viewing.
This is why CTR is a signal, not a score. The useful question isn't only, “How many people clicked?” It's, “Did the packaging attract the audience this video can satisfy?” Satura's breakdown of what keeps YouTube videos alive after the click is useful for creators who want to connect the thumbnail decision with the viewer journey that follows.
Realistic CTR Benchmarks by Platform and Traffic Source
CTR only makes sense inside its medium. A click on an organic YouTube recommendation, a display ad, and a Google search result represents a different decision from the viewer. Comparing those percentages directly is like comparing a search request with a banner interruption.
For YouTube, recent traffic-source benchmarks commonly place Search around 8%–15%, Suggested Videos around 5%–10%, and Browse Features around 3%–7% (traffic-source benchmark breakdown). The ranges reflect intent and placement. Searchers have already expressed interest, Suggested viewers have related viewing context, and Browse viewers are making a faster choice among many options.
| Platform / Source | Typical CTR Range | What Counts as Strong |
|---|---|---|
| YouTube Search | 8%–15% | Toward the upper end, when retention supports the click |
| YouTube Suggested Videos | 5%–10% | Strong topical match and sustained viewing |
| YouTube Browse Features | 3%–7% | Upper end with broad recommendation appeal |
| YouTube overall guidance | 2%–10% | Context-dependent, with the middle often treated as practical |
| Google Display Network | About 0.35% median | Meaningfully above the channel and industry norm |
| Overall display advertising | About 0.46% average | Relative strength depends on targeting and placement |
| Organic search, position 1 | About 27.5% | Strong for that ranking position |
| Organic search, position 2 | About 14.65% | Strong relative to the ranking context |
| Organic search, position 3 | About 8.99% | Strong relative to the ranking context |
| Organic search, position 10 | About 2.42% | Expected to be lower because visibility is weaker |
The display figures come from benchmark reporting that places the Google Display Network median at about 0.35%, alongside an overall display CTR of about 0.46% (display advertising benchmarks). Another benchmark summary describes many display sectors as clustering between 0.22% and 1.08%, with the result shaped by relevance, targeting, and placement context (display CTR ranges).
Organic search needs the same caution. Ranking position strongly influences clicks, so a result at position 1 shouldn't be evaluated against one at position 10. A benchmark set places organic CTR at about 27.5% for position 1, 14.65% for position 2, 8.99% for position 3, and 2.42% for position 10 (organic search CTR by position).
Use a YouTube CTR calculator to verify the basic relationship between impressions and views from impressions, then open the traffic-source report before deciding whether the result is weak. Your overall percentage can conceal a healthy Search result and a struggling Browse result, or the reverse.
Why CTR Alone Can Be a Trap
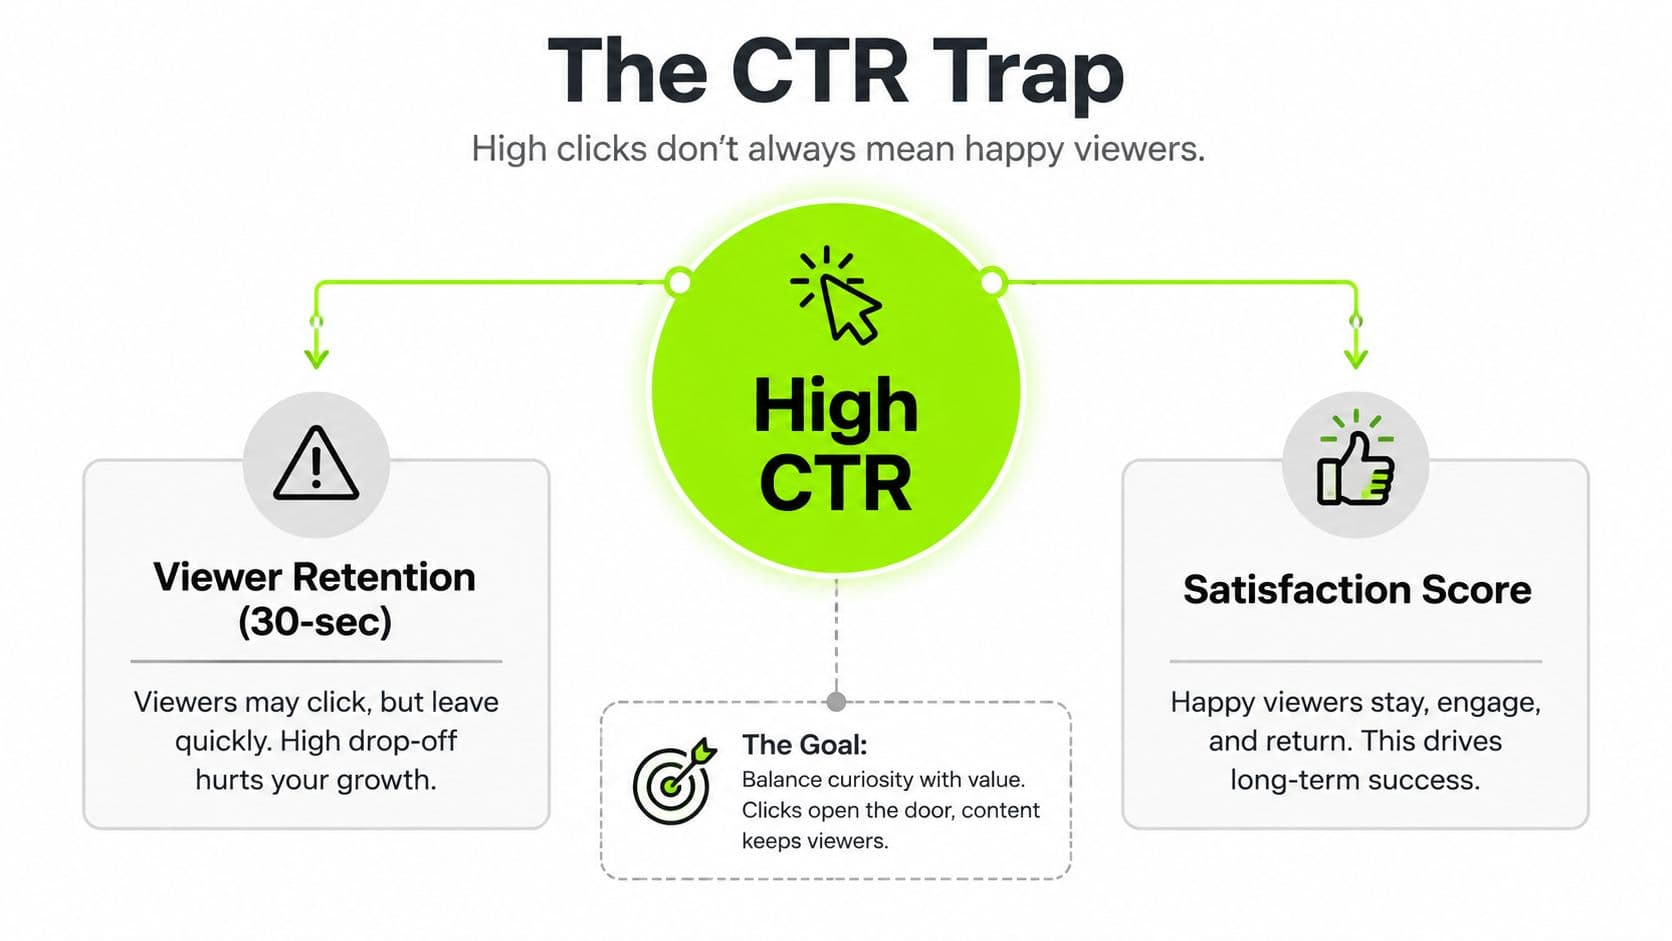
A high CTR proves that the packaging earned clicks. It doesn't prove that the video earned satisfaction.
The most damaging mismatch appears when a thumbnail and title promise one experience, but the first moments of the video deliver another. Viewers recognize that mismatch quickly. They leave, and the video has fewer opportunities to build watch time, session quality, comments, shares, or repeat viewing.
Recent creator guidance describes this problem through a “CTR minus retention gap” approach. The useful measurement isn't raw CTR in isolation. It's the distance between the attention your packaging earns and the viewing behavior that follows (CTR and retention analysis).
Read the first moments as a promise check
Don't use retention as a separate report you inspect only after judging CTR. Read both metrics together:
The practical trade-off matters. A creator can raise clicks by making a claim more dramatic, but that change may attract viewers who don't want the full video. A clearer package may produce fewer impulsive clicks while giving the opening a better chance to retain the people who arrive.
Recommendation systems increasingly evaluate the quality of the viewing experience rather than treating a click as the finish line. That doesn't make CTR irrelevant. It makes promise accuracy more important. The strongest packaging creates enough curiosity to win the click while making the viewer feel, within the opening, that they chose correctly.
- High CTR, sharp early drop-off: The packaging may be too sensational, unclear, or mismatched with the actual topic.
- Moderate CTR, strong early retention: The video may be attracting fewer people, but the audience fit is healthier.
- Low CTR, strong retention: The content may satisfy viewers once discovered, while the title or thumbnail fails to earn enough impressions.
- Low CTR, weak retention: Both the packaging and the opening likely need attention.
How to Diagnose Weak CTR Using Analytics
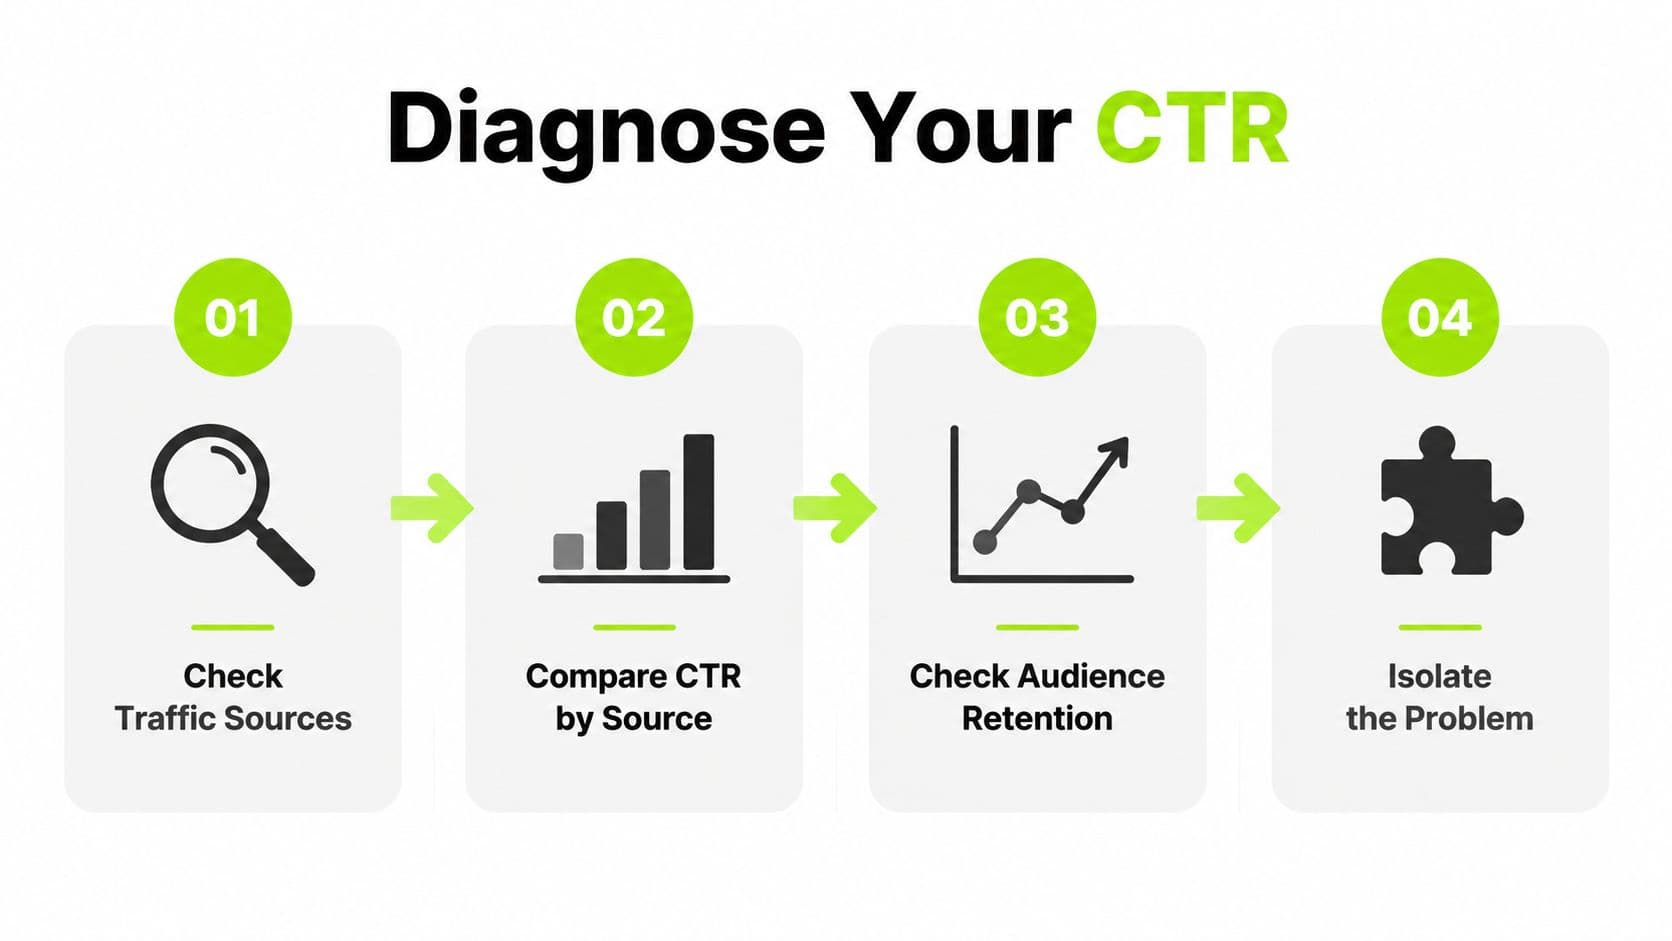
Start with traffic sources, not the thumbnail editor. YouTube Studio's overall CTR is an average across different discovery environments, so the first job is to find where the weakness lives.
Separate the source before changing the package
Open the video's Reach analytics and compare YouTube Search, Browse Features, and Suggested Videos separately. Then inspect the audience retention graph, especially the opening portion, to determine whether the problem begins before the click or immediately after it.
Use this decision framework:
A low CTR doesn't always mean the thumbnail is bad. YouTube may be testing the video with viewers who have little connection to the topic, especially when a channel is expanding beyond its established audience. In that situation, replacing the thumbnail can distract from the actual issue, which may be topic selection or audience fit.
The right diagnosis is often “wrong audience for this package,” not “bad thumbnail.”
For Shorts, the equivalent analysis changes because viewers generally swipe through the Shorts Feed instead of clicking a traditional thumbnail. Creators repurposing long-form videos should examine the first frame, caption, opening beat, and swipe behavior. This analytics guide for YouTube Shorts growth provides useful context for reading short-form discovery differently from long-form impressions.
Satura's video analytics platform can help translate performance signals into plain-English feedback. Its Trustscore analytics and Growth Coach are designed to connect packaging, hook strength, retention, swipe behavior, share rate, and posting consistency, so a creator can investigate the reason behind a weak result rather than reacting to one percentage.
- Search is healthy, Browse is weak. The topic may work for a defined query but lack broad-feed appeal. Improve the visual stop power and clarify the wider viewer benefit before rewriting the entire idea.
- Browse is healthy, Search is weak. The video may be compelling in recommendation contexts, but the title doesn't align closely enough with the language searchers use.
- Both Search and Browse are weak. Packaging deserves the first review. Look for a vague title, low visual contrast, an overcrowded thumbnail, or a promise that doesn't communicate a specific outcome.
- CTR is acceptable, retention collapses early. Stop chasing more clicks. Check the opening for delayed context, excessive setup, or a promise the video doesn't confirm quickly.
Actionable Tactics to Improve Thumbnails Titles and Hooks
Packaging is a chain, not a single asset. The thumbnail earns visual attention, the title sharpens the promise, and the opening hook confirms that the viewer made the right choice.

Begin with the viewer's reason for clicking. If the video solves a specific problem, make the outcome unmistakable. If it offers a surprising explanation, let the thumbnail create the visual question while the title supplies the context. Avoid making both elements repeat the same sentence.
Build a controlled testing habit
Create meaningful variations instead of cosmetic ones. Test a different focal subject, a clearer contrast pattern, a shorter title angle, or a revised promise. Don't change every element at once, because you won't know what caused the result.
A useful workflow looks like this:
A/B testing works best when each version represents a clear hypothesis. You can use YouTube's native testing options where available, or organize your creative review in a tool such as Satura AI's AI Thumbnails and Virality Lab. The platform brings editing, creative testing, and growth analysis into one browser-based workspace, which can reduce the friction between spotting a packaging weakness and producing a new variation.
The thumbnail itself should communicate at a glance. Strong visual contrast helps the subject separate from the background. A face can add emotion when the expression supports the video's actual tension, but an exaggerated reaction that the video can't justify will damage the retention side of the equation. Text should clarify the idea, not turn the image into a miniature paragraph.
Here is a practical demonstration of how thumbnail and title choices can be evaluated as a pair:
- Variant one, clarity: Show exactly what the viewer will learn or gain.
- Variant two, tension: Introduce a visible problem, contrast, or consequence.
- Variant three, specificity: Highlight the audience, tool, mistake, or outcome that makes the video distinct.
Adapt the package to the format
Long-form packaging can rely on a thumbnail-title combination that earns a deliberate click. Shorts, Reels, and TikTok often depend more heavily on the first frame, caption, and opening movement because viewers enter a swipe environment. A repurposed clip shouldn't begin with a long-form introduction that assumes the viewer already understands the setup.
The hook must pay off the package quickly. If the thumbnail says a workflow is broken, show the broken step early. If the title promises a comparison, establish the two options before the viewer has to wait through background. For more guidance on visual promise and composition, use this resource on what makes a good YouTube thumbnail.
Building a Repeatable CTR Optimization Workflow
A single flop is emotionally loud but analytically weak. A repeatable review process gives you enough perspective to identify patterns across topics, sources, packages, and retention curves.
Review your top and bottom performers by CTR, then separate the traffic sources. Compare thumbnail and title variants, inspect retention beside CTR, and record the hypothesis behind your next change. This turns “the video flopped” into a smaller question, such as “Browse viewers saw it, but the visual promise didn't make the topic feel relevant.”
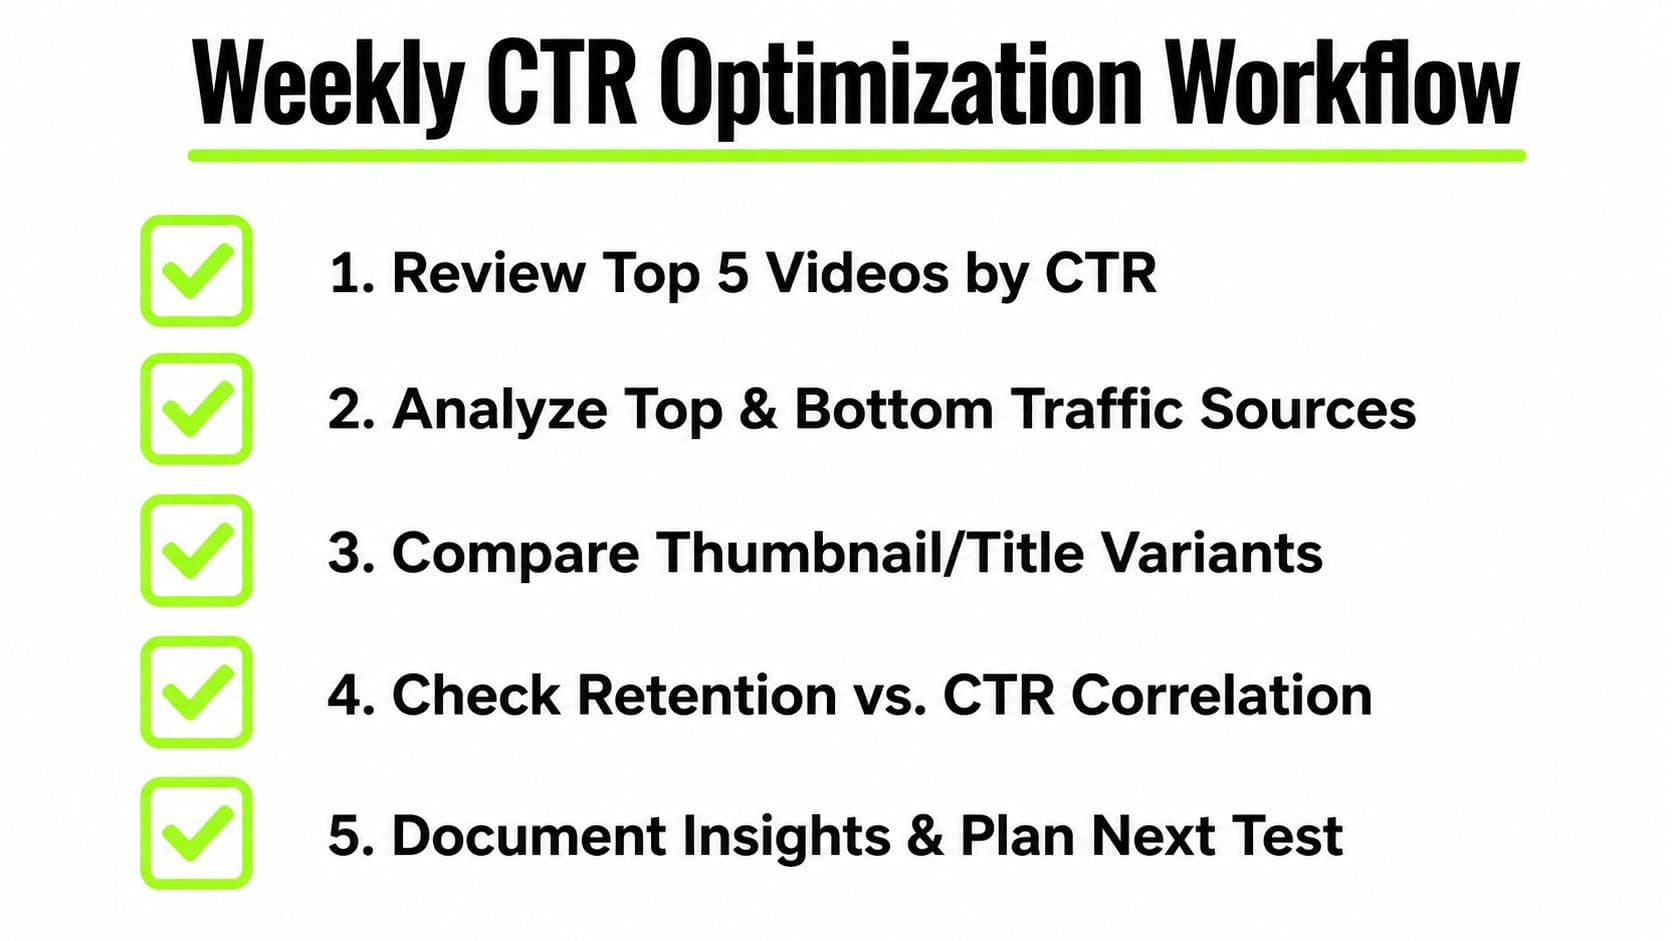
A weekly review can follow five actions:
Re-thumbnail an older video when it still receives meaningful impressions, the topic remains relevant, and the retention curve suggests viewers are satisfied after clicking. Leave the package alone when the video serves a narrow search need and continues attracting the right viewers, even if its browse performance looks modest.
Use YouTube thumbnail A/B testing to structure those experiments instead of changing assets impulsively. The best workflow doesn't force every video toward the highest possible CTR. It helps you choose between broader discovery, precise search visibility, and stronger viewer satisfaction.
Satura AI combines editing, clipping, AI thumbnails, Virality Lab, Growth Coach, and performance analytics so you can improve the full path from impression to retained view. Visit Satura AI to test your packaging, diagnose weak CTR by traffic source, and turn your next upload into a measured experiment rather than another guess.
- Review your strongest CTR videos. Look for recurring thumbnail shapes, title structures, subjects, and promises.
- Inspect the best and weakest traffic sources. Don't let the channel average hide a source-specific problem.
- Compare packaging variants. Keep notes on what changed and why.
- Check CTR against retention. A click only matters if the viewer receives the promised experience.
- Document the next test. Choose one variable and define what evidence would justify keeping it.
What are the common questions?
What is the short answer for What Is a Good CTR for YouTube and Short-Form Creators?
What is a good CTR on YouTube, Shorts, and display ads? Learn realistic benchmarks by traffic source, diagnose weak clicks, and fix packaging with Satura AI.
What should creators do first?
Review your strongest CTR videos. Look for recurring thumbnail shapes, title structures, subjects, and promises.
Who is this guide for?
This guide is for YouTube creators, faceless channel operators, agencies, and teams using AI tools to improve video production and growth.
Action checklist
Apply this to your channel today.
- 1Review your strongest CTR videos. Look for recurring thumbnail shapes, title structures, subjects, and promises.
- 2Inspect the best and weakest traffic sources. Don't let the channel average hide a source-specific problem.
- 3Compare packaging variants. Keep notes on what changed and why.
- 4Check CTR against retention. A click only matters if the viewer receives the promised experience.
- 5Document the next test. Choose one variable and define what evidence would justify keeping it.
Sources & methodology
- Satura editorial guide based on the source video, topic cluster, and article sections.
- Source video reviewed for this article: https://www.outrank.so/